California solar plants supply record 40% of grid; Tariff cuts limit global demand to 79 GW
Our pick of the latest solar news you need to know.

Related Articles
California hits solar output record during supply-demand sweet spot
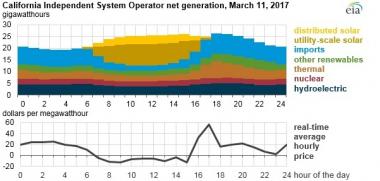
Utility-scale solar power accounted for 40% of California's net grid power generation between 11am and 2pm on March 11, the highest level ever recorded in the state, the Energy Information Administration (EIA) said April 7.
Rising solar capacity has helped lower wholesale power prices in the California Independent System Operator (CAISO) network into negative price territory across some daylight hours, particularly in Spring.
California power demand hits its lowest levels in late winter and early spring while solar output increases as the days grow longer and the sun gets higher in the sky. Negative prices are usually caused by conventional power generators remaining online to avoid high shutdown or restart costs.
Net generation vs wholesale prices on March 11
(Click to enlarge)
Source: EIA, based on monthly electric utility sales and CASIO data.
California's installed solar power capacity has risen from just 1 GW in 2017 to almost 14 GW at the end of 2016.
Californian utilities reported net-metered distributed solar capacity of 5.4 GW at the end of last year, EIA said.
"EIA estimates that this capacity would have generated approximately 4 million kilowatthours (kWh) during the peak solar hours on March 11. This level of electricity reduced the metered demand on the grid by about the same amount, suggesting that the total solar share of gross demand probably exceeded 50% during the mid-day hours," EIA said.
Wholesale power prices in March were substantially lower than in other months of the year and also lower than in March 2016, EIA said.
"In March, during the hours of 8am to 2pm, system average hourly prices were frequently at or below $0 per MWh. In contrast, average hourly prices in March 2013–15 during this time of day ranged from $14/MWh to $45/MWh," it said.
CAISO average real-time hourly price

Source: EIA
California cities shine in solar per capita rankings
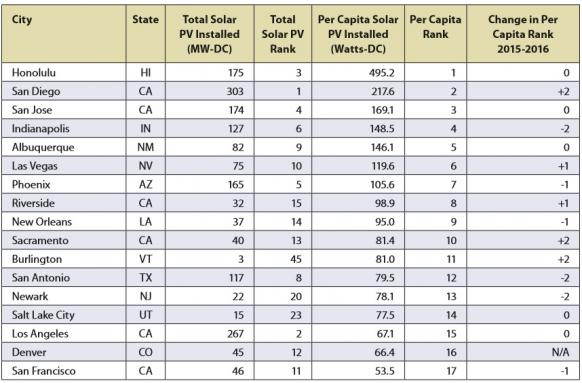
Hawaii's Honolulu is the most solar-friendly U.S. city in terms of installed capacity per capita, followed by California's San Diego and San Jose, a new study by Environmental Group Frontier Group shows.
Some 17 cities have installed more than 50 W per capita and six of these cities are in California.
San Diego, Sacramento and Vermont's Burlington all recorded significant progress in 2016, as the below table shows.
US cities with over 50 W installed solar per capita
(Click to enlarge)
Note: includes rooftop and ground-based capacity within city limits.
Source: Frontier Group's 'Shining Cities 2017' report.
Some 79% of all U.S. rooftops are technically viable for solar power, according to new aerial mapping data published by Google in March.
Google's 'Project Sunroof' has calculated the amount of sunlight on rooftops, taking into account weather patterns, sun position and shading from nearby obstructions. The company then used industry models to estimate energy production.
"Over 90% of homes in Hawaii, Arizona, Nevada and New Mexico are technically viable, while states like Pennsylvania, Maine and Minnesota reach just above 60% viability," Google said on in a statement on its website.
Florida utility to install 1.5 GW in 2019-2023
Florida Power and Light Company (FPL) plans to install 1.5 GW of solar power capacity from 2019 through 2023, the utility said in a statement April 3.
FPL had already announced it would install 600 MW by 2018 and a new Ten-Year Site Plan submitted to the Florida Public Service Commission focuses heavily on new solar and gas-fired generation.
"For the approximately [1.5 GW] of solar anticipated for 2019 through 2023, FPL is working to develop plans and evaluate potential locations. No projects have been finalized yet, but notably, FPL has determined that an undeveloped, company-owned property in western Miami-Dade County could make a promising location for a universal solar facility," FPL said.
"Lower costs that come with nearby transmission and substation infrastructure continue to be a driving force behind the selection of FPL's universal solar sites, as does the company's ability to buy solar panels in large quantities," it said.
FPL provides a Ten-Year Site Plan to the Florida Public Service Commission every year.
For the first time ever, FPL's plan for 2017-2026 forecasts solar power capacity will surpass coal and oil combined by 2020, it said.
Global PV installs forecast at 79 GW in 2017 as major markets slow
Global PV installations are forecast to rise just 2% in 2017 to 79 GW as growth slows in China, U.S. and Japan, IHS Markit consultancy said April 5.
China is forecast to install 26 GW of solar power in 2017, down from 31 GW in 2016, the consultancy said.
China's cuts to feed in tariffs in 2016 have slowed growth, although a grace period for tariff rates will support installations in the second quarter of 2017.
The U.S. is expected to install around 12 GW of solar power in 2017, down from around 15 GW in 2016, mainly due to slowing growth in the utility-scale market, IHS Markit said.
The projection for 2017 is lower than the 13.2 GW forecast by the Solar Energy Industries Association (SEIA) and GTM Research in March. Both forecasts predict a slowdown in utility-scale installations in 2017 following a rush to build in 2016 to meet original deadlines for Investment Tax Credits (ITCs). The deadlines have since been extended.
Japan's solar installations are expected to decline by 10% in 2017, following a 23% drop in 2016 due to cuts to feed in tariffs, IHS Markit said.
India is forecast to install 10 GW of solar power in 2017.
China, US, Japan and India will together represent nearly three quarters of global PV demand in 2017, IH Markit said.
"Even as smaller markets grow on the back of declining module prices, their growth will not be enough to counterweigh impact of demand fluctuations in the largest markets," it said.
New Energy Update


